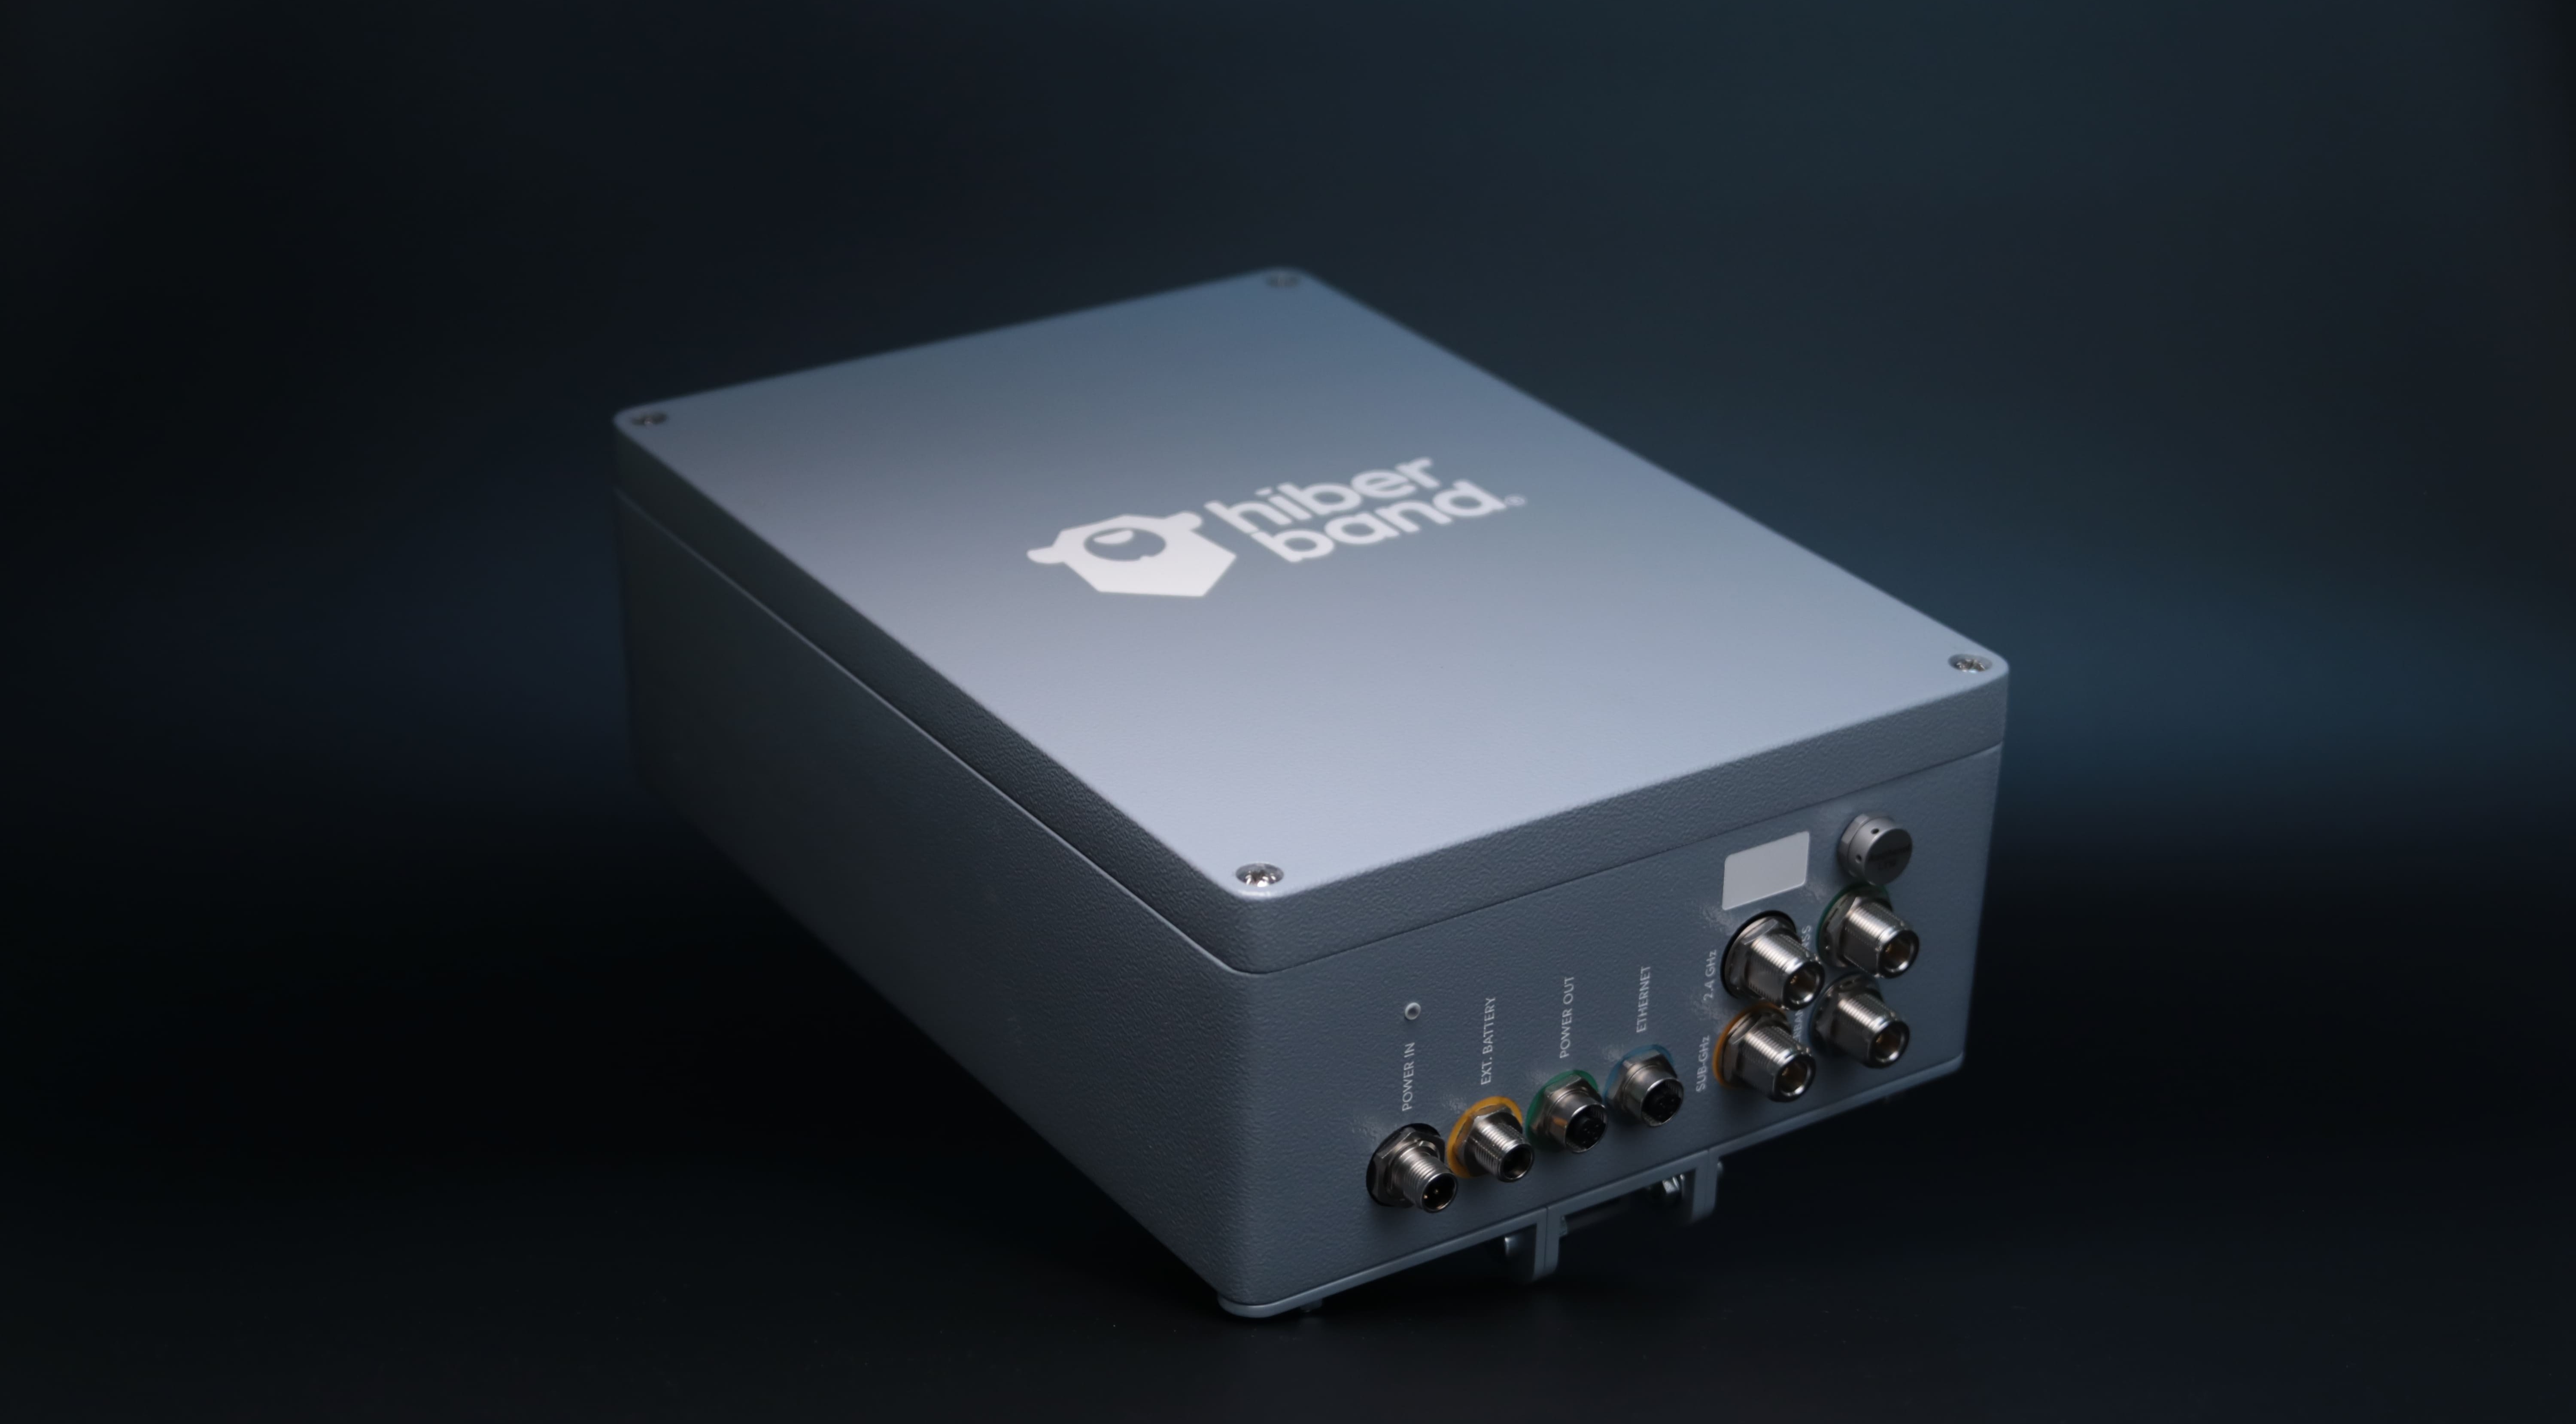
HiberHilo’s so much more than just a box and an antenna and a sensor (though we like to think both look pretty great).
It’s actually a full system that’s designed to make your engineer’s lives easier. We’ve thought of every little detail. From the types of antennae we used. To how you connect it in the first place. Everything about HiberHilo makes wellhead monitoring simple.
One of the big advantages of HiberHilo’s design is the fact that it’s lightweight. The gateway itself is 4 kilograms. And the Broadband Global Area Network (BGAN) device attached to it weighs 1.5 kilos. So it’s perfect for aging oil platforms, where you have to account for every kilo that goes onto the rig, and don’t have a lot of weight to spare. The sensors are also lightweight, clocking in at roughly 1.3 kilograms each. So at its heaviest, the full HiberHilo solution weighs about as much as a hefty housecat.
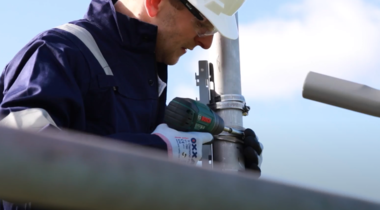
The lightweight is important for aging platforms. But it also makes it easy to attach to a pole and hoist into the air. Which is important if your well is somewhere with dense vegetation, because the BGAN needs to have a clear view of the sky to get the most accurate reading.
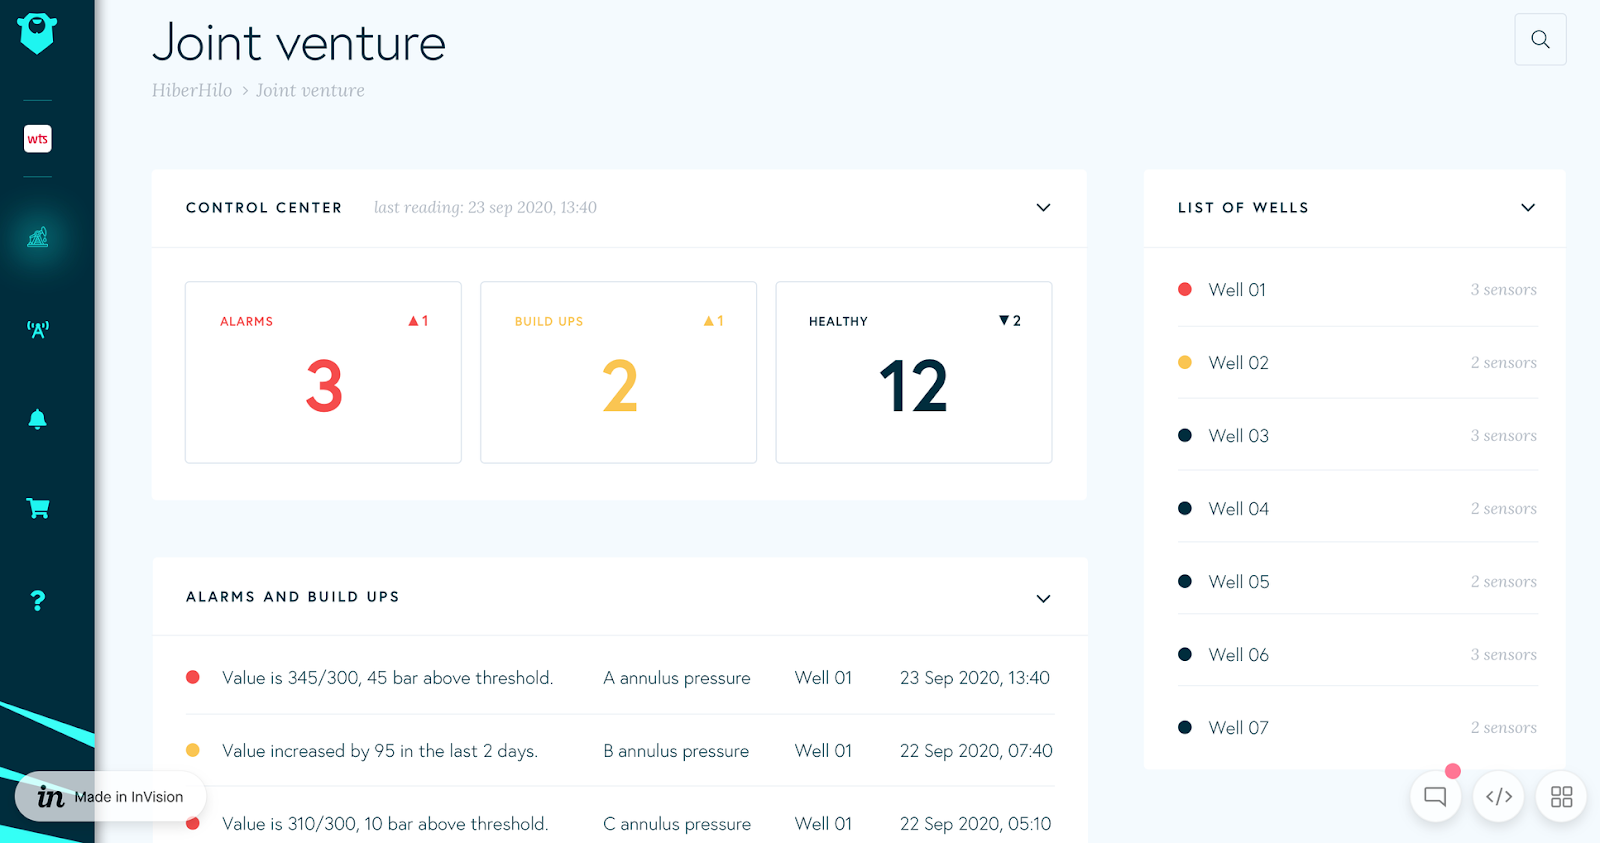
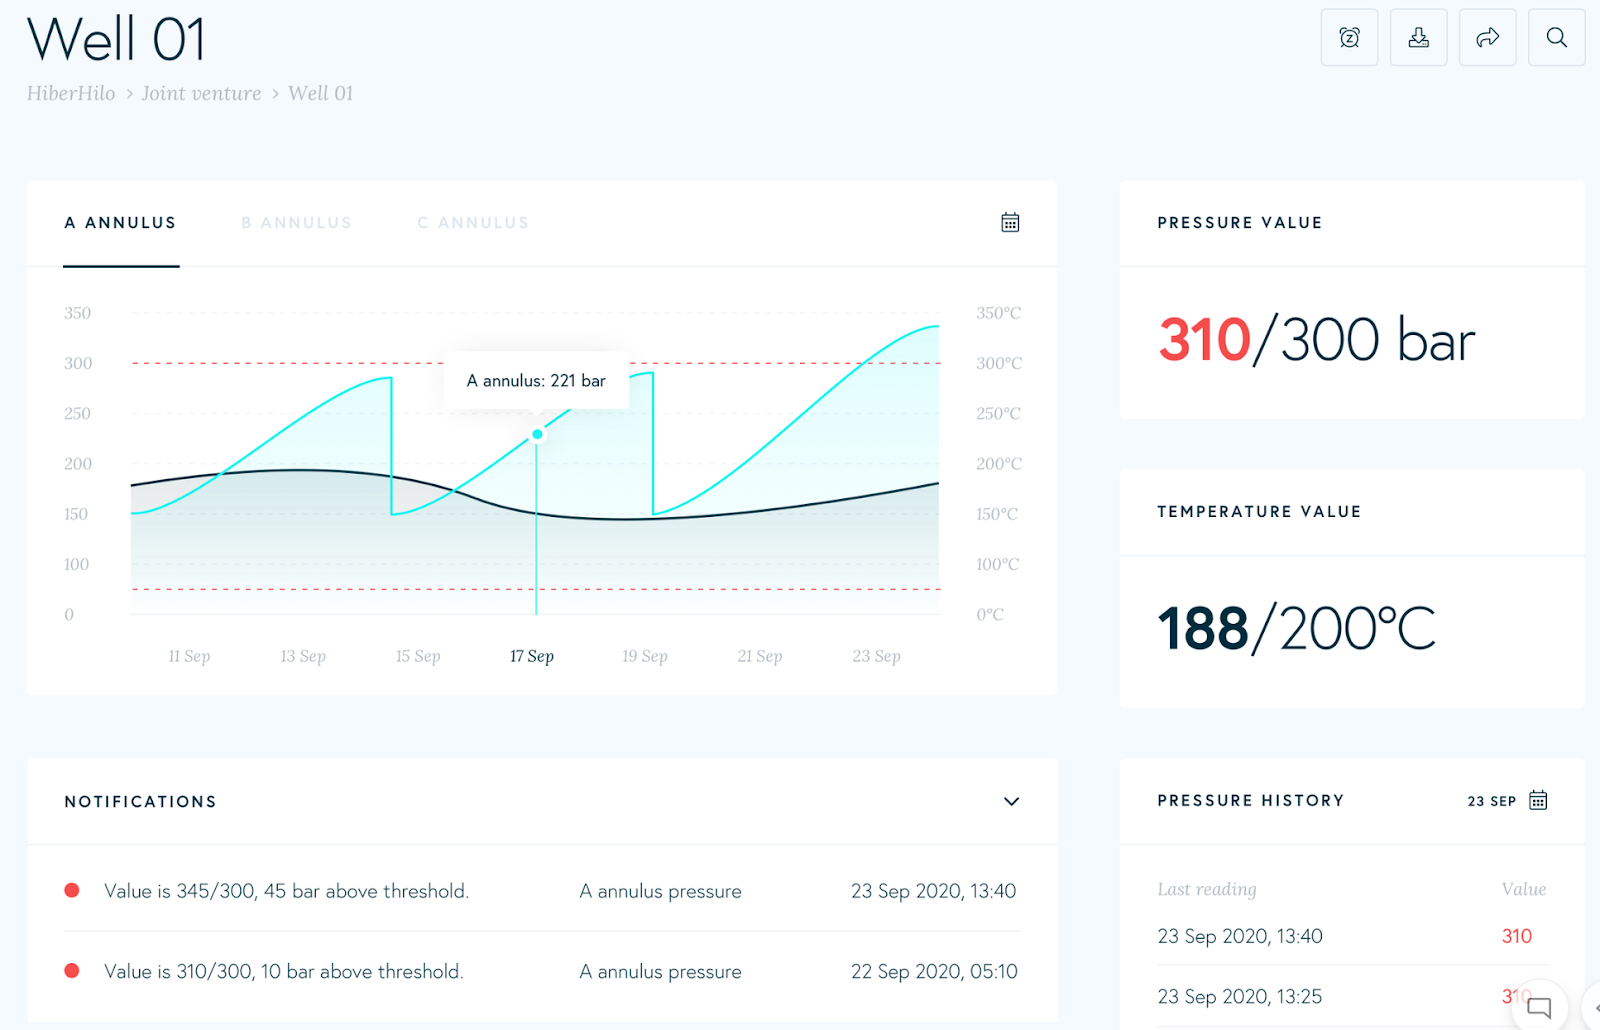
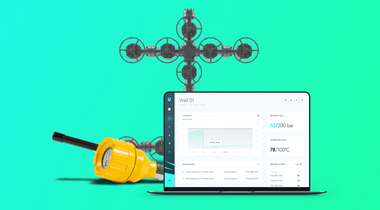
The simple design isn’t just limited to the hardware. HiberHilo’s user interface is also designed to give you quick insights into your wellhead performance, anywhere in the world. In the dashboard you can easily:
- See temperature and pressure sensor readings over time
- Group sensors into wells, and group wells into field complexes
- Export data in .csv